Coronavirus projections are probably wrong. They were never meant to be right.
While in the middle of a global pandemic that’s taking thousands of lives around the world each day and has mostly shut our normal lives down, any good news is welcome. Thankfully, we’ve started getting some, as the models projecting the virus’ impact continue to be revised downward:
The U.S. is enduring a "very bad week" during the COVID-19 pandemic, Dr. Anthony Fauci says. But he also says that the American public's embrace of physical separation and other restrictions is sharply reducing projections of the death toll from the respiratory virus.
The final toll currently "looks more like 60,000 than the 100,000 to 200,000" that U.S. officials previously estimated, Fauci said.
While the new projections increase the case for optimism, they also fuel the fire of rumblings that the “experts” are, and have been, wrong through this whole crisis. While the situation is still very serious, especially in NYC and growing US hot spots like Detroit and New Orleans, many of the worst predictions have failed to materialize. Some wonder if this means that poor data has led to overreaction from the beginning.
Last week, such frustration was directed at London Imperial College researchers, who’s dire predictive model reportedly had heavy influence on the decision-making of leaders in the UK and US. The original model projected around 500,000 deaths in the UK and 2 million in the US if proper precautions weren’t taken. When those precautions did take place, the team’s lead researcher, Neil Ferguson, changed his tune. Per Zeynep Tufekci in the Atlantic:
A few days after the U.K. changed its policies, Neil Ferguson, the scientist who led the Imperial College team, testified before Parliament that he expected deaths in the U.K. to top out at about 20,000. The drastically lower number caused shock waves: One former New York Times reporter described it as “a remarkable turn,” and the British tabloid the Daily Mail ran a story about how the scientist had a “patchy” record in modeling. The conservative site The Federalist even declared, “The Scientist Whose Doomsday Pandemic Model Predicted Armageddon Just Walked Back the Apocalyptic Predictions.”
There has been valid and constructive criticism of the Imperial College’s model from other scientists, but this was not among them. The uproar ignored the original data and demonstrated common misunderstandings of how such models work:
But there was no turn, no walking back, not even a revision in the model. If you read the original paper, the model lays out a range of predictions—from tens of thousands to 500,000 dead—which all depend on how people react. That variety of potential outcomes coming from a single epidemiological model may seem extreme and even counterintuitive. But that’s an intrinsic part of how they operate, because epidemics are especially sensitive to initial inputs and timing, and because epidemics grow exponentially.
Such misunderstandings are not necessarily surprising.
For one, we allow the specificity of data to be overly persuasive. When we see clear data and numbers assigned to something, we tend to assume its accuracy and not consider the assumptions or issues beneath them. Numbers are numbers, after all. Who are we to doubt them? Complicated models also benefit from the labor illusion effect: if someone went to enough effort to create an advanced mathematical model that we don’t really understand, they probably know what they’re doing.
We also just generally misunderstand complicated concepts like statistics, complexity, and exponential growth. Without that knowledge, it’s easy to second guess models as being “wrong” without understanding their actual purpose or the situation they’re measuring.
In reality, data is often not particularly accurate or reliable and mathematical models are not meant to be precise predictions of the future.
Issues with data’s trustworthiness is especially true in this case. The coronavirus data is extremely messy. Case numbers are mostly dependent on the rate of testing. Deaths are likely being under counted in some areas and over counted in others. Crucial data points like case fatality rate vary wildly from country to country for unknown reasons. FiveThirtyEight article summarizes this well:
Numbers aren’t facts. They’re the result of a lot of subjective choices that have to be documented transparently and in detail before you can even begin to consider treating the output as fact. How data is gathered — and whether it is gathered the same way each time — matters.
To underscore this uncertainty, take a look at this chart of infectious disease experts attempting to predict the total number of COVID-19 cases in the US in mid-March:
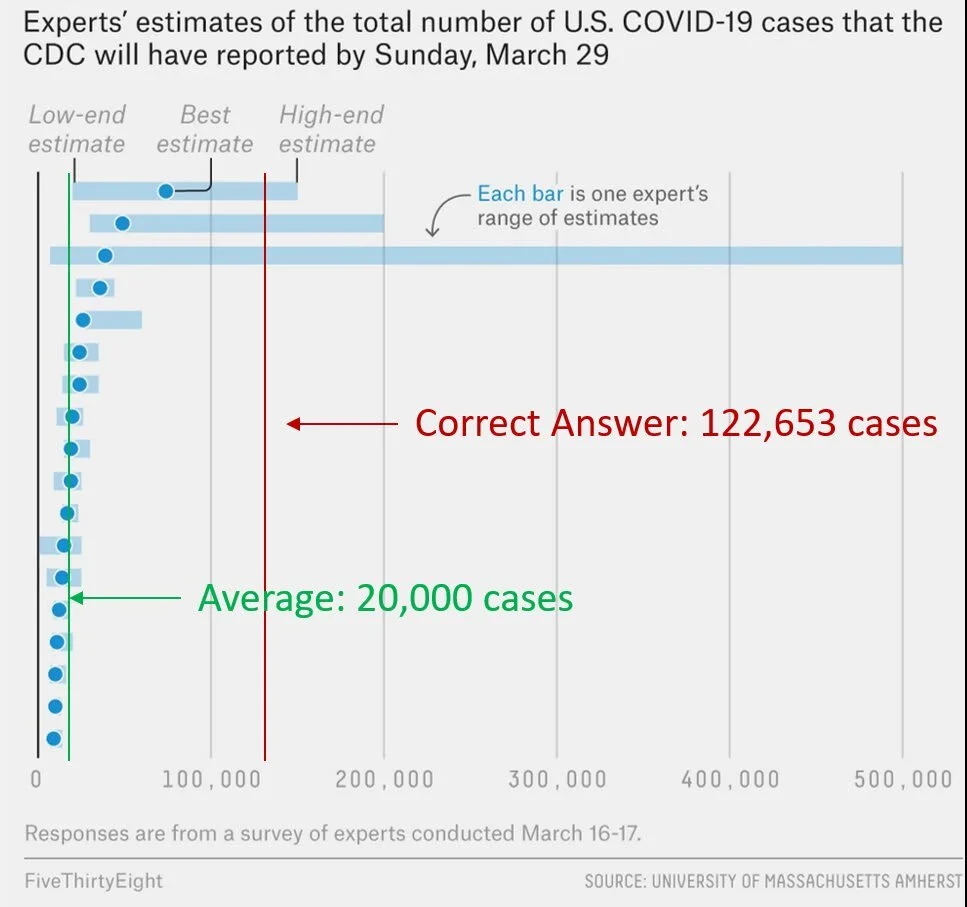
This group was significantly less pessimistic than reality. Are our best experts just bad at their jobs? Not really. The world’s top financial managers generally fail to beat the market every year, too. They’re simply working with imperfect data to predict something that’s too dynamic to really be predictable. Such systems are an example of chaos theory. From The Signal and the Noise:
You may have heard the expression: the flap of a butterfly’s wings in Brazil can set off a tornado in Texas. It comes from the title of a paper delivered in 1972 by MIT’s Edward Lorenz, who began his career as a meteorologist. Chaos theory applies to systems in which each of two properties hold:
1. The systems are dynamic, meaning that the behavior of the system at one point in time influences its behavior in the future;
2. And they are nonlinear, meaning they abide by exponential rather than additive relationships.
…
The most basic tenet of chaos theory is that a small change in initial conditions - a butterfly flapping its wings in Brazil - can produce a large and unexpected divergence in outcomes - a tornado in Texas. This does not mean that the behavior of the system is random, as the term “chaos” might seem to imply. Nor is chaos theory some modern recitation of Murphy’s Law (“whatever can go wrong will go wrong”). It just means that certain types of systems are very hard to predict.
Examples of such dynamic and chaotic systems are the weather, the economy, the stock market, and global pandemics.
In a perfect world, we’d have time to gather more data, evaluate it properly, and end up with clearer choices to make. In a race against a fast spreading disease, we don’t have that luxury. Data shows that delayed action may be especially deadly when exponential growth is at play:

In such situations, we work with what we have and move forward. Thus, researchers create the best models they can with the data available to help world leaders make those hard choices.
Even if we had more reliable data, though, mathematical models like the Imperial College team’s are not meant to be perfect predictions of the future. Psychologically, we tend to think of projections and predictions as the same thing, but in practice, they are very different.
Epidemiological models are projections, not predictions. They are tools to put some kind of boundaries around uncertainty and estimate the impact of our decisions, not a crystal ball into the future. Here’s Zeynep again:
The most important function of epidemiological models is as a simulation, a way to see our potential futures ahead of time, and how that interacts with the choices we make today. With COVID-19 models, we have one simple, urgent goal: to ignore all the optimistic branches and that thick trunk in the middle representing the most likely outcomes. Instead, we need to focus on the branches representing the worst outcomes, and prune them with all our might. Social isolation reduces transmission, and slows the spread of the disease. In doing so, it chops off branches that represent some of the worst futures. Contact tracing catches people before they infect others, pruning more branches that represent unchecked catastrophes.
At the beginning of a pandemic, we have the disadvantage of higher uncertainty, but the advantage of being early: The costs of our actions are lower because the disease is less widespread. As we prune the tree of the terrible, unthinkable branches, we are not just choosing a path; we are shaping the underlying parameters themselves, because the parameters themselves are not fixed. If our hospitals are not overrun, we will have fewer deaths and thus a lower fatality rate. That’s why we shouldn’t get bogged down in litigating a model’s numbers. Instead we should focus on the parameters we can change, and change them.
In a highly dynamic system with many unknowns, there is really no way to be “right” outside of getting lucky. The goal is simply to estimate the possible worst case scenarios so action can be taken to avoid them.
Sometimes, when we succeed in chopping off the end of the pessimistic tail, it looks like we overreacted. A near miss can make a model look false. But that’s not always what happened. It just means we won. And that’s why we model.
Science doesn’t generally work in binaries. It’s not about being “right” or “wrong.” It’s about inquiry, gathering the best information possible, and creating the best parameters for decision-making possible. If those parameters end up being wrong, then we can only hope we end up on the better side of it.
This doesn’t leave models completely off the hook, though. Scientists understand that different models will do things differently, and make different mistakes. Unfortunately, outside of technical qualms that only experienced statisticians can make, reliability can only truly be evaluated after the fact. Thus, no decision-maker should fully rely on one model. They should use multiple sources to see the range of projections available.
Fortunately, we don’t need to be fully dependent on models to guide our strategy. We can use common sense, too.
When facing uncertainty with potentially severe consequences, you exercise the precautionary principle. You don’t need math to tell you that what’s happened in Italy and Wuhan - and is happening in other areas like New York, Spain, and France - is very bad and should avoided at all costs. Even if you don’t trust the virus data from China, you can still observe the extreme measures taken there to get an idea of the severity. We also don’t need complicated models to tell us that countries like South Korea, Singapore, Japan, and Taiwan seem to have fared much better than others. We’ve seen from past pandemics that public health and the economy are intertwined, not antagonistic to each other. We don’t need certainty to play it safe, observe what works, and be adaptive to the evolving circumstances. It’s not about being right; it’s about the consequences of being wrong.
As the common saying in statistics goes, all models are wrong, but some are useful. In the modern, data-driven world, it’s crucial for all of us, but especially key decision-makers, to understand those distinctions. Data and predictive models are not entirely accurate, and were never meant to be. They’re tools in our decision-making toolbox. They may not guarantee we’ll be right, but they can help us be less wrong.